Production & equipment
Measured runtime, downtime and output for every machine, without the clipboard
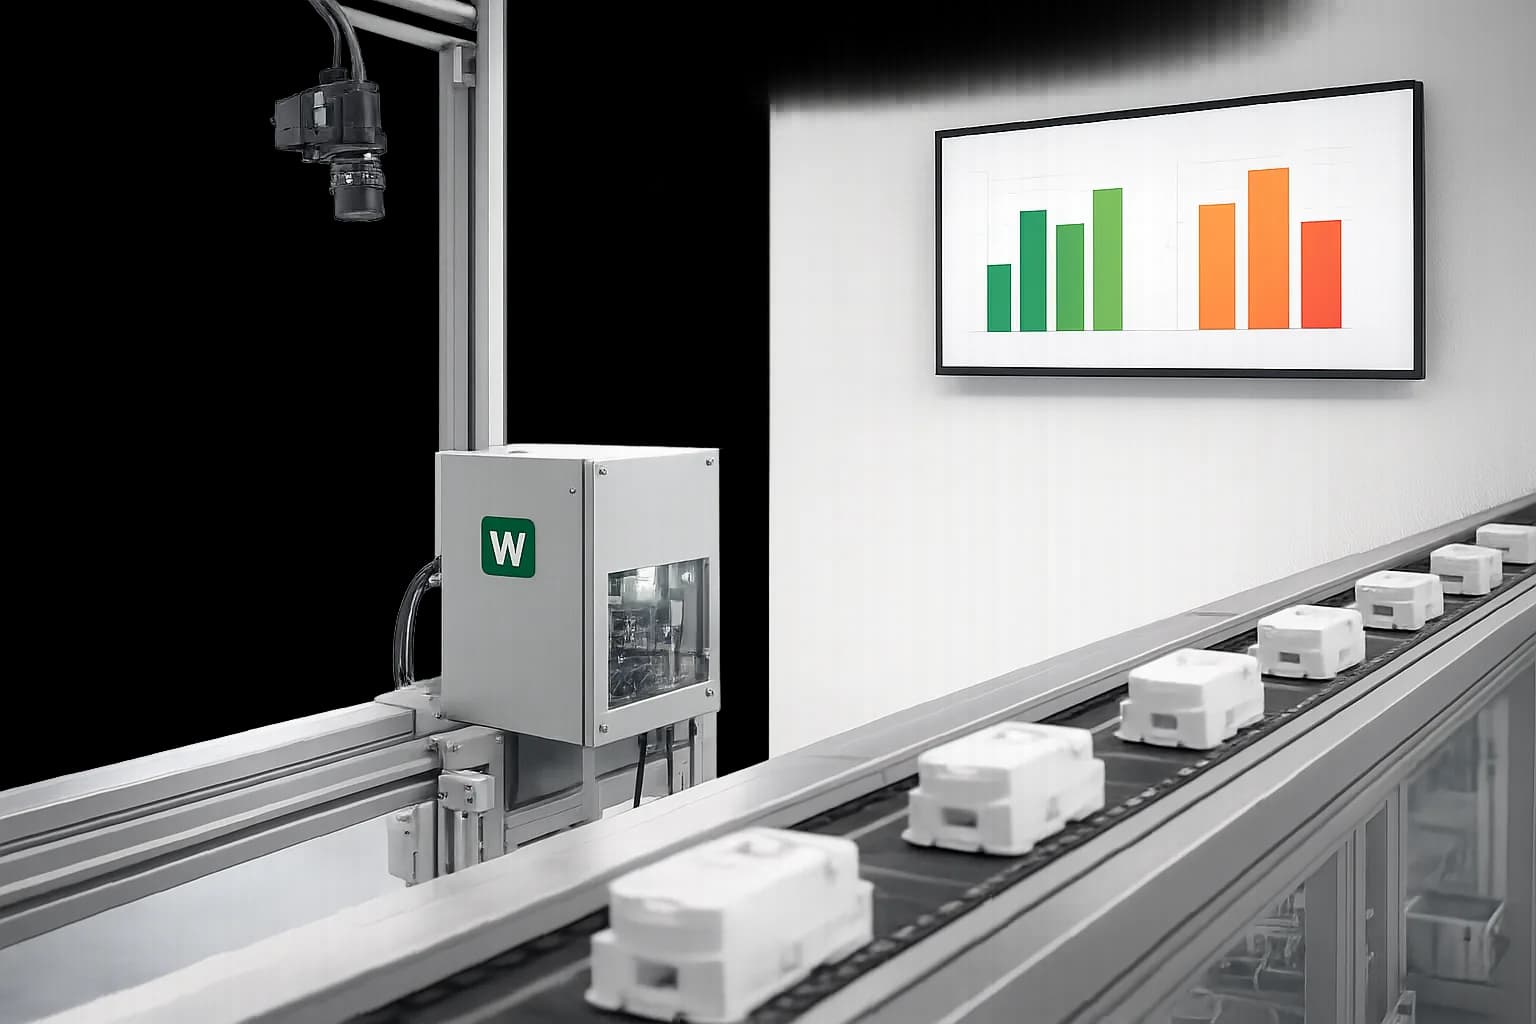
Webkms designs and builds systems that record machine runtime, downtime, cycle times and production counts, spot the trends that matter and turn them into maintenance tasks and shift reports.
When downtime is logged by hand, the short stops never make it onto the sheet and slow drift is invisible until something breaks. We connect sensors, machine signals and cameras to on-site processing so runtime and output are recorded automatically and land in the systems your managers already read.
Who it is for
The operational problems we hear
Small and mid-size manufacturers
Output per shift and true downtime are estimates, so it is hard to tell which line, product or shift is actually costing money.
Processing plants, yards and quarries
Crushers, saws, conveyors and loaders run long hours in harsh conditions, and wear shows up as slowdowns long before a breakdown.
Field service and equipment contractors
Service is booked on a calendar or after a failure, rather than on how hard each machine has actually been working.
What we can build
Examples of what Webkms can build
Every system is designed around your site and workflow after an assessment. These are examples, not fixed products.
Machine runtime and downtime
Power, vibration or machine signals record when each machine runs, idles or stops, including the short stops nobody writes down.
Production counts
Cameras or sensors count parts, pieces or cycles and tie them to the machine and shift.
Cycle-time trends
Cycle times are tracked continuously, so a line that is running slower than its normal pattern is visible within days.
Shift reports and maintenance tasks
Each shift ends with a summary, and agreed thresholds create maintenance tasks automatically.
Illustrative workflow
How one event moves through the system
Illustrative workflow, not a customer case study. Alert thresholds are set with your team during the pilot.
- Step 1
Runtime or downtime recorded
Sensors on line 2 record each run, idle and stop, with start and end times.
- Step 2
Trend identified
Over a week, average cycle time on line 2 creeps above its normal range while the other lines stay flat.
- Step 3
Maintenance task created
A task is opened in the maintenance system for the line 2 team, with the trend chart attached.
- Step 4
Manager receives a summary
The morning summary shows output, downtime and open maintenance tasks for every line.
Integrations
How it connects to your existing software
Runtime, downtime and counts flow into the tools your managers and maintenance team already use.
- Custom development
Maintenance or CMMS software
Work orders created from agreed thresholds, usually a custom integration
- Standard integration
Google Sheets or Excel
Shift logs and production tables
- Standard integration
Databases and BI dashboards
Runtime and count history for reporting
- Custom development
ERP and inventory systems
Production counts posted where an API or import is available
- Standard integration
Email and chat
Shift summaries and alerts
Data handling, video retention and cloud use are agreed during project design. See how processing and connectivity work on the AI cameras and sensors overview.
Process
Assessment, pilot, installation, support
- 1
Assessment
A site walk or video call, sample footage or data, and a written scope: what is measured, what counts as an exception, where results go.
- 2
Pilot
One lane, machine or building first. We compare system output with manual counts or existing records and agree the accuracy that is acceptable.
- 3
Installation
Once the pilot meets the agreed targets, we plan the wider rollout and coordinate installation with your team or local installers.
- 4
Support
Monitoring, maintenance and tuning under a monthly support plan, with changes made as your operation changes.
Pricing
Every project is quoted individually. Cost depends on the hardware, installation, any custom development, the integrations you need and the level of ongoing support. We do not sell fixed packages for this work.
Questions we get asked
Do we have to modify our machines?
Usually not. Many signals can be captured with clamp-on current sensors, vibration sensors or a camera, without opening the machine controls. Where a machine already exposes data, we read it directly.
Can it predict breakdowns?
It can show trends, such as rising cycle times or longer stops, that often come before a problem, and turn them into maintenance tasks. It does not guarantee that every failure is predicted.
We already have a maintenance system. Will this work with it?
Often, yes. Most maintenance systems can accept work orders through an API or import; this is usually a custom integration we build and test during the pilot.
How do we start?
With an assessment and a pilot on one or two machines. Once runtime and counts match what your team sees, we extend the same setup to the rest of the floor.
Talk to us about equipment monitoring
Tell us about the site, the problem and the software you already use. We will come back with what is realistic and how a pilot would work.